Exporting metrics to your own stack
A team can push its own traffic to an external OTLP/HTTP collector - Prometheus, an OpenTelemetry Collector, or anything else that speaks OTLP - from the Metrics export tab of the team.
This requires an ENTERPRISE licence and global.flips.otelExport enabled at install. Without
either, the tab and the OTel targets collection described below are absent, not disabled.
For the full field-by-field reference (metric names, attributes, temporality, series budgets), see Exporting RED metrics over OTLP. This page covers the two things that live specifically in team administration: where the destinations come from, and how a team picks what to send them.
Two objects, two owners
Nothing on this tab lets a team choose where metrics go - only what is sent.
- OTel targets are collector endpoints - a URL, an authentication mode, a credential. They are
created and shared to teams by an administrator (or a user holding the
otelTargets.createright), from the OTel targets collection in the left band. A team only ever sees the targets shared with it, and never the credential: every read of a target shows***in place of it, by construction. - Exporters, authored here on the team, each pick a subset of the team's own traffic and one or more of those shared targets to push it to.
This split means a team lead can wire up an export without ever holding the collector's credential, and an administrator can cut off a whole team's exports in one place - unsharing the target - without touching any exporter.
Required rights
Authoring an exporter (RED or usage) requires the team's settings right. Any team member can
open the tab and read the existing exporters' status.
Two kinds of exporter
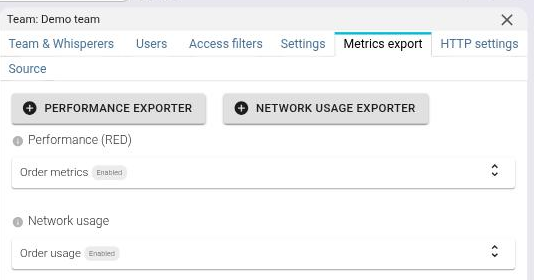
The tab lists both kinds of exporter side by side, each with its own New button.
RED metrics exporter
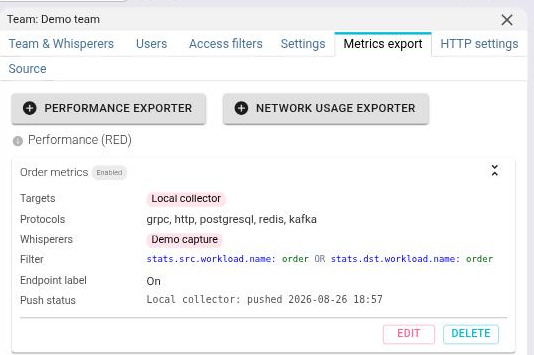
Aggregates the team's captured traffic - the protocols Spider parses - into request-rate, error-rate and duration metrics, grouped by client workload, server workload, protocol and (optionally) endpoint.
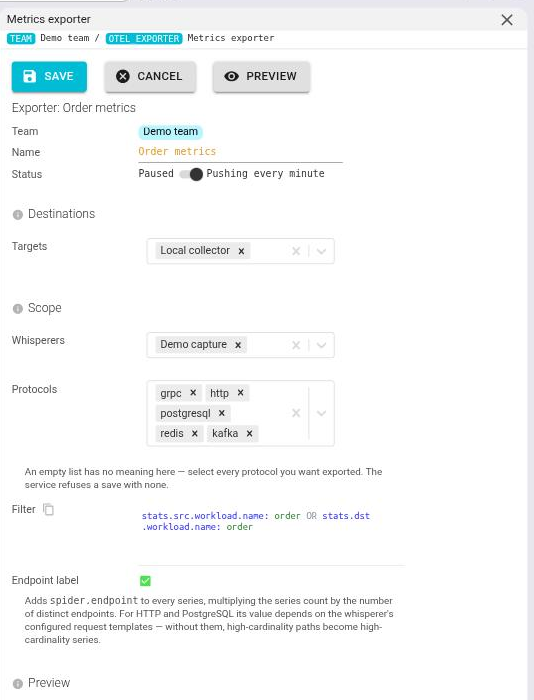
When creating one, you choose:
- Targets - one or more, from those shared with this team.
- Whisperers - the team's own,
INTERFACEcapture mode only. AnUPLOADwhisperer holds a historical import with no live window to roll up, and is not offered. - Protocols - HTTP, PostgreSQL, gRPC, Kafka, Redis. At least one is required; there is no implicit "all".
- Filter - an optional Lucene expression, exactly like a search filter. The field is seeded from your own current access filter, and a button copies your current search filter into it, but nothing is injected silently - what you see in the box is exactly what runs.
- Endpoint label - adds the specific endpoint (URI template, gRPC method, Kafka topic, Redis
command) as a dimension. For HTTP and PostgreSQL this depends on the whisperer's configured
request templates: without them, every endpoint collapses into one
-bucket instead of being useful.
Network usage exporter
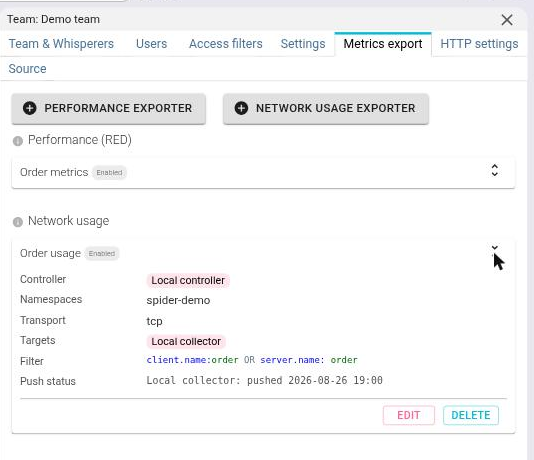
Publishes raw byte and packet counters for all traffic a whisperer's node sees, not only the parsed protocols - including UDP and anything unparsed. It reads the same per-minute rollup that feeds the Network Usage map, so it can answer volume questions the RED exporter structurally cannot: total bytes in and out of a workload, regardless of what protocol it speaks.
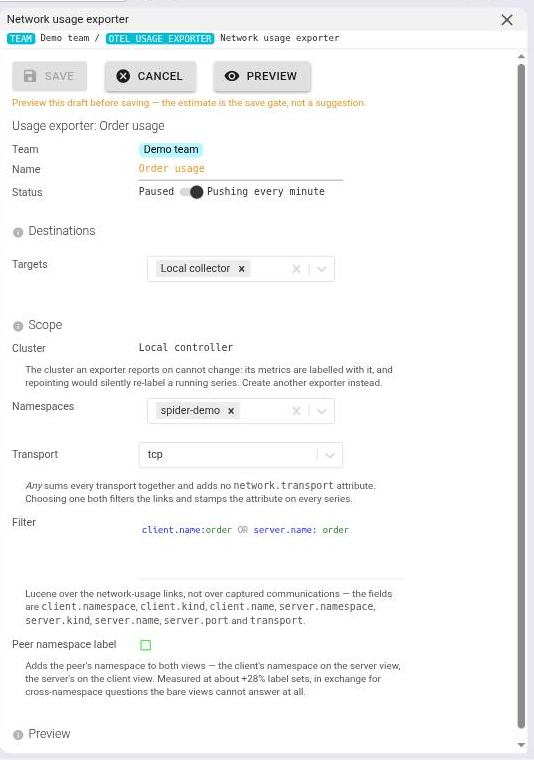
When creating one, you choose:
- Targets - same picker as the RED exporter, one or more shared targets.
- Controller - exactly one. Network usage is scoped by controller, not by whisperer, because the byte/packet counters come from the gociphers attached to that cluster, not from a whisperer's capture.
- Namespaces - a subset of the namespaces your team has been granted on that controller (the same grant the controller's own Share tab manages). Picking a different controller resets this list, since a grant on one controller says nothing about another.
- Transport - optionally restrict to
tcp,udporunknown; left asAny, every transport is summed with no transport label. - Peer namespace label - adds the other side's namespace to every series, so you can ask "who outside my namespace is calling me" or "did this workload start talking to another team's database". It is off by default because it noticeably raises the series count.
Two metrics per direction are published: a server view (spider.network.server.*, this
workload as the one being connected to) and a client view (spider.network.client.*, this
workload as the one dialling out). They are never merged into one metric name - summing them would
silently double every byte, since the same flow is counted once from each side.
Preview before you save
Both exporter forms have a Preview button, and Save stays disabled until a preview has run against the current selection. Preview runs the real aggregation over the next window the exporter would actually process - without saving anything or pushing anywhere - and shows sample series plus an estimate of how many data points a live run would produce.
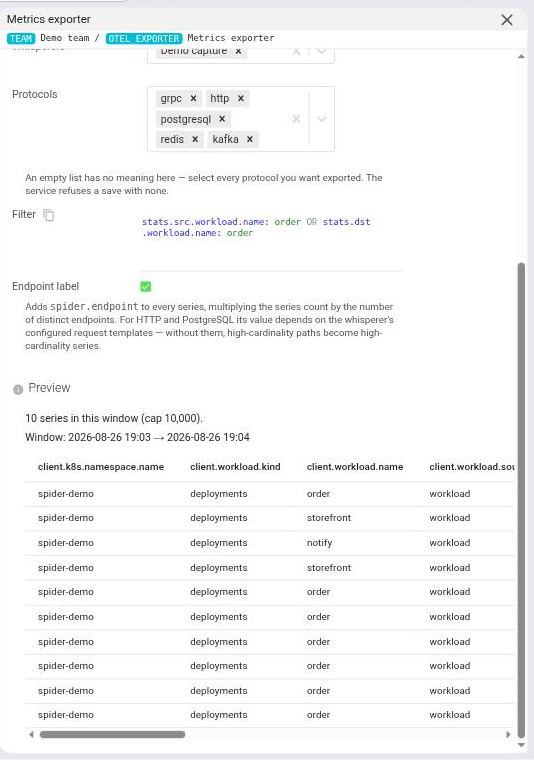
That estimate matters because each exporter is bounded by a fixed per-window series budget.
Overflow is dropped and counted, never silently sampled, and the otelExportDropping alert
probe fires if a saved exporter starts overflowing later. A wide selection - every namespace on a
busy cluster, or the endpoint label without request templates configured - can burn through the
budget fast; the preview is where you find that out before it becomes a gap in your dashboard, not
after.
Any change to a field that shapes the query - whisperers, protocols, filter, controller, namespaces, transport, either label toggle - invalidates the last preview and re-disables Save. Renaming an exporter does not: the name plays no part in the aggregation.
Reading exporter status
Each exporter card shows push status per target, not just for the exporter as a whole: last window pushed, last error, and consecutive failures. An exporter fanning out to three collectors can be current on two and stuck on the third - the per-target breakdown is how you tell which one needs attention.
Two alert probes cover both exporter kinds and stay inactive on installs that do not use the feature:
| Probe | Fires when |
|---|---|
otelExportStale | an enabled exporter's target has fallen too many windows behind |
otelExportDropping | an exporter overflowed its series budget on its last run |
Timing and your collector
Metrics are never real-time. A RED exporter's window closes two minutes behind, a usage exporter's four minutes behind - long enough for captured traffic to finish its own journey through parsing (RED) or through the per-node batching and per-minute merge (usage) before the count is final. Pushing sooner would under-report a window that is still filling up.
Every push is delta: each window carries only what happened in that one minute, not a running total. Your collector must accept that:
- Prometheus's native OTLP endpoint does, directly.
- An OpenTelemetry Collector needs the
deltatocumulativeprocessor in its pipeline if whatever sits behind it expects cumulative sums.
This is also why a failed push is never retried into a later window - replaying a delta would double-count it permanently - and why an exporter that falls too far behind skips the missed windows instead of backfilling them once it catches up.
Scope narrows automatically, never widens
An exporter's effective scope is recomputed on every run, not read once at save time:
- A RED exporter's scope is its own whisperer list intersected with the team's current whisperers. Remove a whisperer from the team and that exporter stops emitting for it, with no edit to the exporter.
- A usage exporter's scope is its selected namespaces intersected with the team's current grant on that controller. Narrow the grant on the controller's Share tab and the exporter follows.
Either way, a target that gets un-shared or disabled stops receiving from every exporter that used it, on the very next run. Nothing here can ever cause an exporter to see more than it was authorised for when you last saved it - only less.